Claude Code can report CONNECTION_CLOSED: Connection closed when a server crashes at startup, a required environment variable is missing, or a relative script path points nowhere. Those are three different failures with the same message. Inside a session the same failure surfaces as MCP error -32000: Connection closed (as in claude-code issue #78726); start with the same check.
I ran seven broken stdio servers, plus a healthy one and one that logs to stdout, through the MCP Inspector, Claude Code and Codex to see which output actually separates them.
The short answer: to debug an MCP server, launch the Inspector CLI with the same command, arguments, working directory and environment as your client. Read the server’s stderr above the Inspector’s final error. A ✔ Connected label or a configured entry proves less than it looks like: it may not prove tools loaded or a tool call works.
What does MCP Inspector show that the client hides?
The MCP Inspector launches the server as a child process and speaks MCP to it. Its CLI prints the process’s own stderr, so a Python traceback or missing-key message can sit right above Connection closed. Claude Code showed that same connection message for three different faults in my lab; Codex sometimes printed nothing and had no tool available.
I ran each fault once on 8 November 2026: one minimal Python 3.15 JSON-RPC server on macOS 26 / Apple Silicon, with MCP Inspector CLI 2.13.0, Claude Code 2.1.319 and Codex CLI 0.167.0. This is a diagnostic sample, not a reliability trial. The Inspector was run from its cached package; npx reported 2.14.0 as the latest version that day.
| Deliberate fault | Inspector CLI 2.13.0 | Claude Code 2.1.319 | Codex 0.167.0 |
|---|---|---|---|
| Healthy server | Lists get_weather | ✔ Connected | Tool starts; this lab call was blocked by approval policy |
| One plain stdout log line | Lists tool | ✔ Connected | Tool starts |
| Crash at startup (stack trace on stderr) | Traceback, then Connection closed | CONNECTION_CLOSED: Connection closed | No message; model says “no tool” |
Missing WEATHER_API_KEY | Error names the variable, then Connection closed | Same CONNECTION_CLOSED | No message; “no tool” |
| Wrong relative path | can't open file, then Connection closed | Same CONNECTION_CLOSED | No message; “no tool” |
Command not on PATH | spawn weather-mcp-server ENOENT | ENOENT: Executable not found in $PATH | No message; “no tool” |
| Exits after initialize | Connection timed out after 15,000 ms | Connected, then tools fetch failed: connection closed | No message; “no tool” |
Schema lacks "type": "object" | Returns "tools": [] | Connected, then tools fetch fails with inputSchema.type error | Tool starts; schema accepted |
| 70-second startup | Connection timed out after 15,000 ms | Times out after 30,000 ms | No message; run ended at about 10 seconds |
If the client says connection closed, run the process directly through Inspector CLI; if Inspector names a missing file, key or executable, fix that input first.
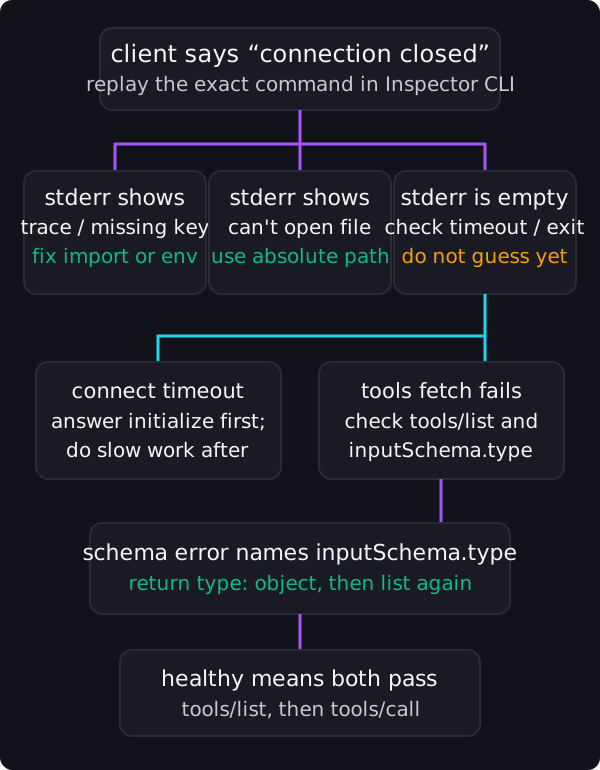
Decision paths follow the 8 November 2026 lab output and the MCP Inspector CLI documentation, checked 8 November 2026.
How do I run MCP Inspector against the same server?
Use --cli for a short, repeatable probe; use the web UI when you want to inspect schemas and manually call tools.
The lab used Node with npx, Python 3.15 and Inspector CLI 2.13.0. For the current package, the Inspector README listed Node ^22.23.4 || ^24.22.1 || >=26.12.1 when checked 8 November 2026; pin @2.13.0 below to match the measurements.
Start the Inspector web UI with npx -y @modelcontextprotocol/inspector. The web client uses port 6274 by default (Inspector README, web client README, checked November 2026). If the command prints a different URL, use that address.
For a stdio server, substitute the exact command and arguments from your client:
npx -y @modelcontextprotocol/[email protected] --cli python3 ~/mcp-lab/server.py ok --method tools/listExpected result: exit code 0 and a JSON object containing get_weather with an object input schema. The command and result are from the 8 November lab. Replace python3 ~/mcp-lab/server.py ok with your own launcher and args; don't use a different shell command from the one your client runs.
To test a specific tool, request a call and pass the tool’s real argument names:
npx -y @modelcontextprotocol/[email protected] --cli python3 ~/mcp-lab/server.py ok --method tools/call --tool-name get_weather --tool-arg city=ParisExpected result: text Paris: 14C, light rain (run on 8 November). If the server needs a key, pass it to the Inspector process with -e. This is the lab server that died with WEATHER_API_KEY is not set:
npx -y @modelcontextprotocol/[email protected] --cli python3 ~/mcp-lab/server.py missing_env -e WEATHER_API_KEY=replace-with-your-key --method tools/listExpected output: the get_weather tool list, where the same command without -e ended in Connection closed. If that happens with your server, the client config is missing the variable: add it to the server's env block there. -e KEY=value is the Inspector CLI's documented environment option (CLI reference, checked November 2026). Keep a real key out of shell history and screenshots.
To reuse a server config instead, use a JSON file with mcpServers, command, args, env and cwd, then run npx -y @modelcontextprotocol/[email protected] --cli --config ./mcp.json --server my-server --method tools/list; the Inspector config guide defines that shape. Expected result: a tools array for the named server.
What should I fix when the Inspector prints an error?
Read the first server-side line before the Inspector’s closing message. It usually gives a more specific repair than the client does.
| Inspector output | Likely cause | Fix to try |
|---|---|---|
ModuleNotFoundError or another traceback | Process crashed while importing or initializing | Run the same command in a terminal and install/fix the named dependency in that runtime. |
WEATHER_API_KEY is not set or equivalent | Client process did not receive required environment | Add the required value to the client’s env config; for Inspector, use -e KEY=value. |
can't open file / ENOENT | Bad script path or executable missing from the client’s PATH | Use an absolute script path; configure the executable’s full path if the GUI client cannot find it. |
Connection timed out after 15000 ms | Server did not finish connecting before Inspector’s default ad-hoc deadline | Fix a hung startup first; a longer --connect-timeout <ms> did not get our 70-second server past a 60-second limit on initialize (below). |
"tools": [] or Claude’s inputSchema.type validation error | Tool schema is missing the required object type for that client | Return "type": "object" and valid properties in each tool’s inputSchema; rerun tools/list. |
| Process exits after the initialize response | Server died before discovery completed | Keep the process alive and answer tools/list; inspect the exit path after initialization. |
Relative paths often work in your terminal because its working directory is the project root. A desktop client may start the same command from elsewhere.
The Inspector config supports an explicit cwd, while Claude Code sets CLAUDE_PROJECT_DIR for its spawned server; use the configured working directory or an absolute script path (Inspector config guide, Claude Code MCP docs, checked November 2026).
For a missing executable, the lab showed Claude Code’s ENOENT message directly. If the command works in your terminal but not in the client, compare command -v your-server with the executable configured in the client; set an absolute executable path when needed.
On Windows, wrap npx as cmd /c npx …; Claude Code's docs issue #47635 quotes the docs' warning that without it you get Connection closed.
Why does one client connect while another drops the tool?
“Connected” may only mean the initialization handshake succeeded. In my run, Claude Code printed ! Connected · tools fetch failed for both a server that exited after initialization and one whose tool schema lacked "type": "object".
The second case exposed an actual compatibility failure: Anthropic rejected our production tool list with HTTP 400 because a schema omitted that field, while OpenAI-style endpoints accepted the same tool list. Pinning [email protected] restored the object schema; Octomind now skips non-object schemas and logs a named error so the whole turn isn't rejected.
I build Octomind, so that production example is my own. Octomind’s /mcp health checks server health; /mcp validate checks tool parameter schemas.
Its timeout_seconds default is 30 and acts as an idle deadline that progress notifications reset, with an absolute cap at 20 times the configured value (MCP tools docs, checked November 2026). Those checks help when the server is configured in Octomind; Inspector is the direct probe when you need to reproduce the child process outside a client.
The lab also challenged the usual stdout diagnosis. A plain Starting weather server v1.2 ... line did not break Inspector, Claude Code or Codex in this test.
That result doesn't make stdout logging safe: stdio uses stdout as the JSON-RPC channel, and the MCP TypeScript SDK docs explain that non-JSON output can break parsing.
The Claude Code issue #47635 requested clearer malformed-stdout troubleshooting and was closed as not planned; the issue is context, not a reproduced bug report for every client. Send logs to stderr, but when one harmless line appears to work, don't stop checking other causes.
Which timeout should I change?
Only raise a timeout after the Inspector confirms that the server eventually responds. A missing executable, crash or missing key will not be repaired by waiting longer.
In my lab, Inspector CLI 2.13.0 used a 15,000 ms default --connect-timeout; Claude Code 2.1.319 reported 30,000 ms; the Codex 0.167.0 run ended after about 10 seconds without an error message. Those are measurements from this version set, not universal defaults.
For documented settings, Claude Code uses MCP_TIMEOUT for server startup and MCP_TOOL_TIMEOUT for tool execution; per-server timeout in .mcp.json overrides the latter. Codex exposes startup_timeout_sec and tool_timeout_sec in a server's [mcp_servers.<name>] table (Claude Code MCP docs, Codex config reference, checked November 2026).
I didn't rerun Claude Code or Codex with new values.
The Inspector's own knobs didn't stretch far enough. I gave the 70-second server a 90-second limit two ways: the --connect-timeout 90000 flag, and a config file with connectionTimeout and requestTimeout both at 90000, the fields the Inspector config guide describes. Both runs failed after about 61 seconds:
{"error":{"code":"error","message":"Request timed out after 1m00s (initialize). 1 request is unanswered: initialize (sent 1m00s ago). No response has been received this session.","cause":"Request timed out"}}In Inspector 2.13.0 the first request has a 60-second ceiling that those settings didn't lift. A server that needs more than a minute before it answers initialize can't be probed this way, and Claude Code and Codex gave up sooner in the lab.
Make the server answer initialize first and do the slow work afterwards: download packages ahead of time, and load models lazily on the first tool call. A slow first tool call can then report progress, which resets idle deadlines in clients that support it.
How do I know the server is healthy, and how do I undo the probe?
For this tutorial, healthy means tools/list returns the expected tools and tools/call returns the expected result. A client’s status is one clue, not the complete check.
Codex mcp list reports configuration (enabled in this lab), while a codex exec that can't see the server may say nothing about why. Claude Code's claude mcp list performs a health check (Claude Code MCP docs, checked November 2026); in the lab, its ! Connected · tools fetch failed line still meant no tools were loaded.
If you only ran Inspector CLI commands above, there is no client config to undo. Stop the web Inspector with Ctrl+C. If you added a temporary Claude Code entry, remove it with claude mcp remove <name>; for Codex, remove that server’s [mcp_servers.<name>] table from ~/.codex/config.toml (Claude Code MCP docs, Codex MCP docs, checked November 2026).
Keep a copy of the relevant config before removing a server you already depend on.
If the process connects and then dies later, check the machine’s memory limit and kernel logs. We saw a memory MCP server killed by the kernel’s OOM handler on a 1 GB cloud machine: its two default models needed about 1.1 GB and 547 MB, and the memory peak reached the 1 GB limit. Smaller defaults brought peak use to 542 MB.
This is a separate “connected, then closed” failure; if you see a sudden mid-session transport close, check whether the operating system killed the process before changing a startup timer.
For a server you are still building, start with the custom MCP server tutorial. For the protocol context, see what MCP is.